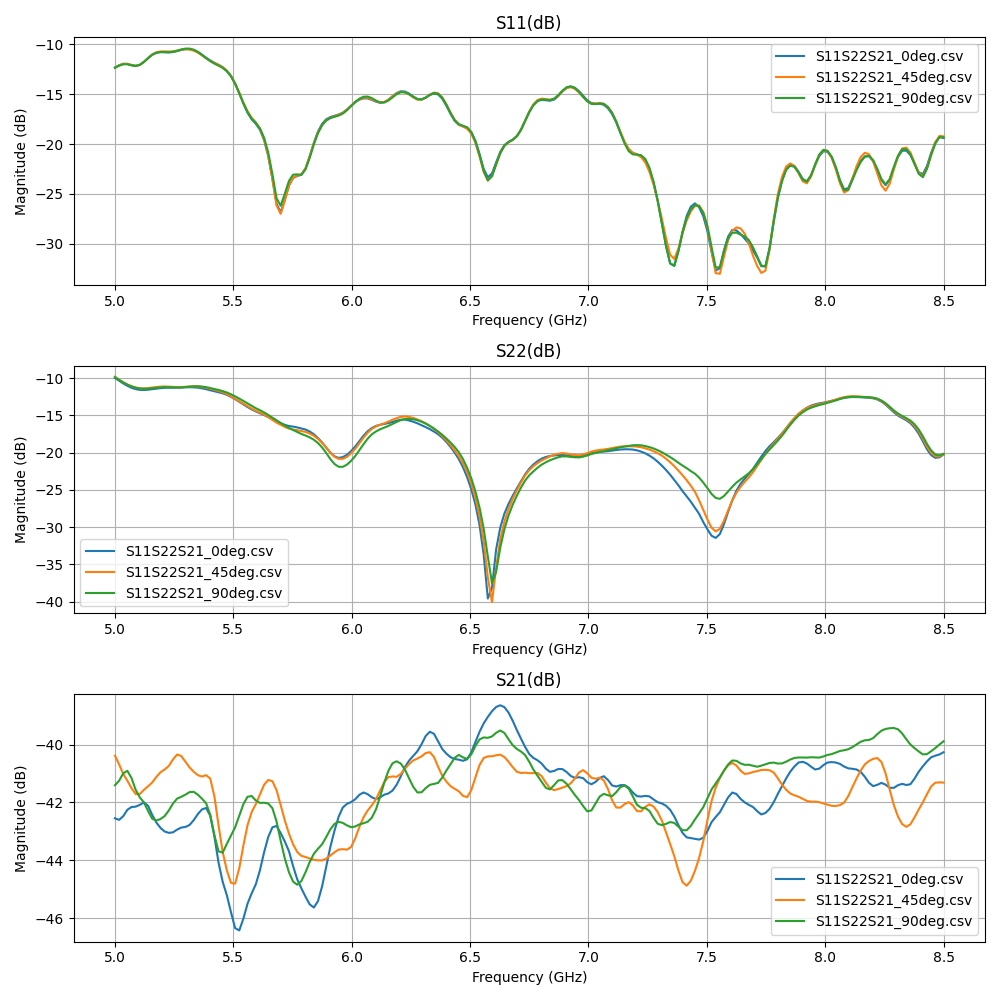
S11 & Impedance Bandwidth
Return-loss and bandwidth analysis from VNA .csv or Touchstone .s2p files.
What you need
- A 2-port (or 1-port) VNA capture with S11 in dB
- Optional: a
-10 dB(or custom) threshold to define "in-band"
In the GUI
- Scan type: VNA
Ctrl+Oand pick the.csvor.s2pfile- The S11 plot appears with optional limit lines
- Set Limit Lines dialog lets you mark pass/fail thresholds per band
What you get
| Metric | Definition |
|---|---|
min_s11_dB |
Best (most negative) return loss in the sweep |
bandwidth_mhz |
Frequency span where S11 ≤ threshold (default -10 dB) |
band_start_ghz / band_stop_ghz |
Edges of the matched band |
fractional_bandwidth_pct |
$200 \cdot (f_2 - f_1) / (f_2 + f_1)$ |
| VSWR | Voltage Standing Wave Ratio derived from S11 |
Programmatic / MCP
Returns the same metrics as JSON. See tools reference.
Common gotchas
- Calibration matters. RFlect doesn't apply VNA calibration — bring already-calibrated data.
- Threshold convention. -10 dB ≈ 90% power match. Some specs use -6 dB or -3 dB; set explicitly.
- Single-band assumption. The bandwidth metric reports the widest contiguous matched band; multi-band antennas will need per-band analysis.
See also
- Group Delay — derived from S21 phase
- UWB / SFF — full UWB channel characterization